Does your device really display 4K?

That’s far from certain. A surprising number of 4K devices will downscale high resolution still images to 1080p, then upscale them again, losing detail in the process. This can be hard to see with regular photos, so here is a 4K test image that makes things completely clear. It consists of four bundles of horizontal lines and four bundles of vertical lines, with twelve in each bundle, and a different colour for each horizontal bundle and each vertical bundle. The whole image is 3,840 pixels wide by 2,160 pixels tall.

Each line is only one pixel thick and the space between the ten inner lines of each bundle is also only one pixel thick. The two outer lines are two pixels away from the inner lines.

There are also some markers near the screen boundaries to show if there is any overscan at all. Here’s a detail of the centre of the image:

4K test image detail

If your device is delivering full 4K, you will see it on your TV’s screen precisely defined with those spaces between the lines. But if your device is downscaling to 1080p at some point in the chain

, then that definition will disappear and this is what you will see:

4k Image, downscaled then upscaled

To get the full image, right click here and choose the appropriate item to save the image.

buy kamagra 100mg

Posted in 4K, Testing | 1 Comment

Another nail in the 24 bit audio coffin

24 bit audio resolution is vital in modern digital recording. And in mixing. And in processing.

But it’s increasingly looking pointless in music delivery at the consumer level. I’ve previously reported on the inability of listeners to distinguish between high resolution (typically, 24 bit, 96kHz or DSD) audio and the same content ‘throttled down’ to a CD-standard 16 bit, 44.1kHz presentation.

Likewise, I’ve shown that it’s likely that most of the extra eight bits in 24 bit audio are being used to encode noise.

Now I’ve stumbled across the blog of an audiophile who seems particularly rigorous, and he’s conducted a rigorous test with some 140 volunteers in which they were presented with three high resolution (96kHz sampled) music clips

, each in two versions: the original 24 bit recording and the same content reduced in resolution to 16 bits. He took a number of careful steps to make sure that the comparison files could not be easily distinguished by non-listening means.

His results: read the whole thing because he slices and dices the results in interesting ways. But in short, for the three clips the results were random. Precisely half were right and half were wrong for two of the clips, while for the third a few more were wrong than were right. Only one group (audio engineers) were consistently more than 50% correct, but with n=34, and the highest result at 55%, this can also be safely regarded as random.

Notable categories to do worse than the whole: those confident in their results, and hardware reviewers.

Of course, some of the participants got all three right. But, then, some got all three wrong as well. As the author notes:

Looking at the individual responses, there were a total of 20 respondents who correctly identified the B-A-A selection of 24-bit samples, and 21 selected the opposite A-B-B. This too is in line with expectations that 17.5 would pick each of these patterns based on chance alone.

One note: I suspect that if 16 bit and 24 bit resolutions are distinguishable, they are more likely so in lower sampling rate audio: 44.1 or 48kHz. Although to be fair

kupbezrecepty.com

, 24 bit audio does tend to be associated with high sampling rates.

Posted in Audio, Codecs, Imperfect perception | Leave a comment

Doubting measurements

The other day I was reviewing some very high quality bookshelf-sized loudspeakers, and decided I’d check their bass extension. What I measured was quite at odds with both my listening impressions and the manufacturer’s specifications. The makers say 50 hertz more or less flat, 42 hertz at -6dB. That was also my sense. Very solid with what it did, but lacking a firm underpinning of deep bass.

But my measurements said flat to about 36 hertz

buy cheap kamagra oral jelly

, -6dB at 32 hertz. Which is such an impressive result I immediately doubted my measurements. I’ve recently acquired a new high-end microphone pre-amplifier/ADC (Focusrite Forte) and was quick to blame that.

To check, I tested the bass end of some mid-priced floorstanding loudspeakers and the result was remarkably similar. Could the Forte be doing something weird?

I still had my old FastTrack Pro interface around — Windows 8.1 broke its drivers so it now only works at 44.1kHz sampling, whereas the Forte goes up to 192kHz. It gave the same results. I filled most of the morning using different test tracks, different amplifiers, different digital decoders, different recording and analysis software, and even a different microphone (not a measurement one, but one with reliable bass so I could see if anything was grossly wrong).

Eventually the issue was more or less resolved. Instead of measuring on tweeter axis at one metre, I measured from my listening position which is sort of on-axis, but about 2.7 metres away. The bottom end now went down to 44 hertz and fell away quite quickly. Do’h! That’s what I was hearing!

Regardless, it does seem that the loudspeaker maker is being modest in its bass claims.

Despite all this, my morning’s efforts had left my confidence in my measurement rig a little shaken. This morning, however, I was measuring a different speaker (with a claimed low end extension of 25 hertz!) which gave a weaker than promised result. Indeed, a weaker response than the bookshelf. So I left the microphone in place and changed back to the bookshelf speaker for final confirmation. Yes

, the rig is capable of measuring substantially different bass ends, from which I can conclude that it’s probably accurate!

Posted in Audio, Testing | Leave a comment

Skeptic’s Guide to the Universe on Neil Young’s high res audio kickstarter

So it turns out that Neil Young in raising money via Kickstarter to develop a high resolution music store and player (‘Pono’), based around 192kHz, 24 bit audio. The Skeptic’s Guide to the Universe had an interesting discussion on in it their most recent episode. Well worth a listen. Here are a few thoughts I posted on the SGU forum:

Interesting about the audio stuff (which is my bread and butter). High sampling rates and high bit depths are valuable in recording and production, but pretty useless in delivery. Having said that, it isn’t quite the slam dunk Steve suggests. Nyquist tells us that a sampling rate of double the maximum frequency which you seek to record is all that is necessary. So why not 40kHz sampling rather than 44.1kHz or 48kHz? A naive analogue to digital conversion of the original leads to artefacts from any ultrasonic content being reflected back down into the audible band. So a low pass filter is applied prior to the conversion. In the early days that was analogue. To use a steep filter to reduce the signal level enormously between

Buy Kamagra Without Prescription

, say, 20kHz and the CD-standard Nyquist point of 22.05kHz resulted in tons of phase shift. 48kHz was a bit better. Most of those technical problems, though, are pretty much under good control these days. We’ve come a long way.

In the episode there was some unfortunate conflation between different things. Neil Young apparently wants 192kHz, 24 bits. CD standard is 44.1kHz, 16 bits. I don’t think anyone has yet conducted a sound study capable of demonstrating an improvement in sound from the higher resolution. But what most of us listen to on our iPods isn’t the CD standard. It is a lossily compressed version of the CD standard, usually in MP3 or AAC format. Modern portable players do support lossless (typically ALAC for Apple products, FLAC for others).

Incidentally, Monty overblows possible negatives of 192kHz, 24 bit recording. The problem is pretty much that it’s a waste of space, not that there will be audible intermodulation and similar artefacts. If you play the test audio he provides in the article you may well hear stuff, but the two ultrasonic spikes in his test, for example, peak at -3dBFS. Actual ultrasonic music content at those frequencies — if any, and generally there won’t be any — will be way down somewhere below -80dBFS. They can intermodulate all they like and you’re never going to hear it.

Now Monty has made a good case elsewhere at Xiph that using a good quality MP3 encoder (LAME) set to variable bitrate (VBR) running at about 192kbps (compared to the 1,411.2kbps of the uncompressed audio), the sound cannot be distinguished from the original. I don’t disagree. However the great majority of content on portable players doesn’t meet that standard. Stuff encoded to MP3 back in the 1990s was frequently pretty poor.

One last thought: Neil Young’s quest for 24 bit, 192kHz probably will yield improved quality for catalogue recordings. Not because of the high resolution, but because some of the stuff will be remastered from the original source material using modern technology and engineers concerned with producing a premium product. That’s why DVD Audio and SACD discs typically sounded better than the original CDs.

Posted in Uncategorized | 1 Comment

Is digital inferior to analogue audio?

Linn Products is a very famous UK high fidelity equipment firm. It really came to prominence in the 1970s in making the argument that the turntable had been overlooked as a critical component in the playback chain. It’s contribution at the time was the highly regarded Linn Sondek LP12 turntable. Linn products typically manage to include a ‘k’ in their names.

Nowadays Linn has quite a line-up of digital products in addition to its analogue ones, but back in the day its founder Ivor Tiefenbrun was a prominent exponent of the supposed deficiencies of digital audio.

On a visit to Canada in 1984 his claims were put to the test, via double blind listening tests, as reported by the Boston Audio Society.

In each case his assertions as to being able to hear particular phenomena proved unfounded. Of particular interest: they did an ABX test using LPs on a Linn/Naim/Linn system, comparing straight-through with an ADC/DAC inserted into the signal path. No positive results for that either. The ADC/DAC was as basic as you could get: a Sony PCM-F1 VCR-based recorder. By ‘basic’, I am comparing with today’s standards. Back then it was so cool to have a relatively inexpensive, relatively portable way of recording real, actual digital content.

But basic it was: 44.1kHz sampling and (according to the linked article, although I hadn’t realised this) only 14 bits of resolution.

Here was the first test:

The gains of the “A” and “B” paths were matched in both left and right channels to within 0.05 dB at 1 kHz using the PCM-F1’s gain controls. This was done by measuring across the amplifier output terminals. The match was then confirmed to be within ± 0.25 dB across the whole audio band. The PCM-F1’s “peak hold” feature was used to keep a record of the peak signal levels passing through it during the test

, especially in view of the relatively high sensitivity of the Naim power amplifier (<1 Vrms at clipping) and the relatively low listening levels chosen by the participants. More about this shortly. After an acclimatization period, a set of 10 trials was conducted in an unhurried fashion before breaking for lunch, after which a further set of 10 trials was conducted. Tiefenbrun's score for the series was 11 correct decisions out of 20, a result which shows no statistically significant ability to discriminate between "A" and "B" any more accurately than would be expected on the basis of random guessing. At this point I thought that I could reliably distinguish between the "A" and "B" paths on the basis of the slight noise level increase which occurred when the PCM-F1 was inserted into the chain, and which was marginally audible due to the high gain of the Naim MAP 250 power amplifier combined with the low peak signal levels through the F1, which the peak-hold meters showed to have risen no higher than -20 dB. (0 dB is the digital clip point, and these peak levels were somewhat unfair to the digital processor since 20 dB of its signal-to-noise ratio was being thrown away.) [In other words, for this segment of the test the F1 was in effect a 13-bit processor. - Ed.]

Actually, ‘Ed.’ is being a little kind. If you’re running a digital capture system with 20dB of headroom

buy-kamagra-oral-jellies.com

, then your new effective ‘Full Scale’ is some 3.32 bits below the theoretical FS. So the ADC/DAC cycle was running at 12.68 bits.

BUT, if the link above is correct (and Wikipedia seems to confirm it), and the PCM-F1 used 14 bits, then the system was effectively 10.68 bits. That would give it a noise floor of around -64dBFS, which the author of the article could hear, but would not be obvious when playing an LP, since the noise floor of LP’s is typically higher.

Do read the whole article because they continue the test with very interesting results.

Note: this test does not prove that digital conversion is inaudible. But should be easy enough to prove the deficiencies of digital audio — if there are any — with a suitable double blind test, and the lack of tests with clear positive results is suggestive.

Posted in Audio, Codecs, Imperfect perception, Testing | 3 Comments

Spam Art

The motivations of spammers are clear: they’re hoping to worm their way onto a blog or into someone’s consciousness in order to attract business. But why would anyone think that an attempted blog comment consisting of almost nothing but 1

,039 gmail addresses would achieve this? A spam generating robot gone mad perhaps?

Still, it made for an interesting pattern on the approve/reject screen:

List of email address 

<p style=2pharmaceuticals.com/medicine

, half size” width=”372″ height=”454″ class=”aligncenter size-full wp-image-4375″ />

Posted in Admin, Misc | 1 Comment

Washed out shows on SBS2

What’s going on at SBS2? I’m rather enjoying some of the shows they are running there

, including the excellent ‘Orphan Black’, a smart sci-fi thriller. But some of the shows look very washed out. That includes ‘Orphan Black’, and also re-runs of ‘30 Rock’. Here’s a typical frame from the latter:

30 Rock on SBS2 - Washed out

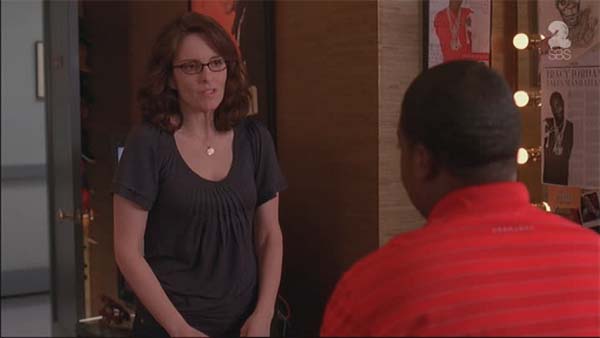
Blacks aren’t very dark. Whites aren’t very bright. The whole thing looks

kamagra pills

, as I said, Washed out.

Here, by comparison, is a frame from an advertisement for another show that appeared on the same station a few minutes later:

Ad soon after, full black to white scale

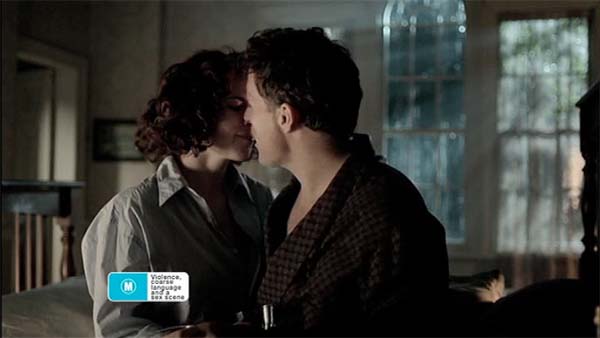
Blacks are as black as your display will allow. Whites are as white, etc.

Just to make it clearer, here’s a frame from the closing credits of ‘30 Rock’. The background should be black. I’ve pasted a real full black box over the top:

30 Rock panel with overlaid black square

On my large projection screen the washed out appearance seems quite a bit worse than it appears on a computer monitor. (On one of my computer’s monitors, I see now, the darker black is almost invisible. I need to recalibrate that monitor.)

Looking closer: on a scale of 0-255 — the eight bits with which each colour is encoded — the darkest value for ‘30 Rock’ is 15 for all three colours. On the same scale the brightest white is 242 for all three colours, or some 13 short of the maximum. By contrast (sorry) the other frame ranges from 0 for all three colours (bottom right of frame) to 255 for all three colours (the white in the ‘M’ box).

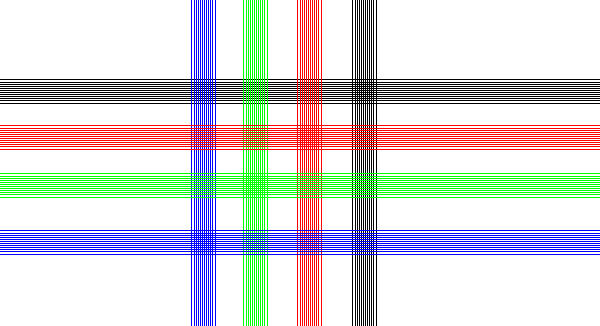
To my eyes the washed out appearance was reminiscent of a mismatch between RGB video modes. There are two somewhat different modes. As I mentioned, each colour is encoded using an 8 bit number. For computer style signals, a 0 for a particular colour is zero saturation (ie. black), while 255 is full blast. All three colours at 255 makes full white.

But for historical reasons, consumer video RGB the settings are different. For full black each colour is 16 on the 0 to 255 range, while full brightness is 235. Values of 0 to 15 can be carried as well, but they just show as black. Values of 236 to 255 show at full brightness (full white when all three are at least 235).

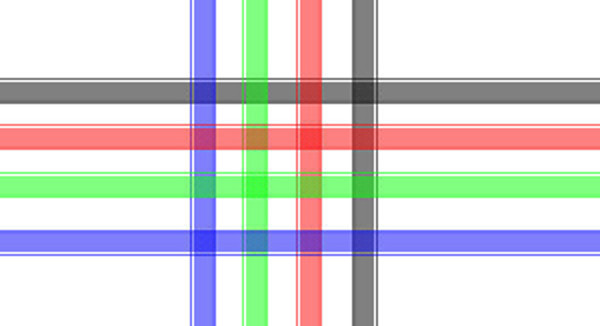
TVs are typically calibrated so that an RGB signal is stretched so that 15 becomes a 0 in appearance on the screen, and 235 looks like 255. But if the display thinks that the RGB is a computer style signal, it won’t stretch the range and the picture will look washed out.

The numbers for ‘30 Rock’ don’t quite match up (range 15-242 rather than 16-235), nonetheless my guess is that somewhere in the delivery chain the video has been accidentally treated as PC style.

Posted in Uncategorized | Leave a comment

Efficiency

Have you ever wondered how they get the sound so loud in cinemas, not to mention rock concerts?

It isn’t by applying lots of power, although that helps. Mostly it is by using highly efficient loudspeakers. That is, loudspeakers that convert a significant proportion of the incoming electrical energy into acoustical energy.

That, as it happens, is something that is quite difficult to do.

Krix Commercial Cinema kx-5986 loudspeakerConsider an average high quality high fidelity loudspeaker. You can probably argue with this

Compra Minocin Online

, but I’d guess that the average sensitivity is 89dBSPL output for 2.83 volts input, measured at one metre. (Why 2.83 volts? That’s the voltage required for one watt of power into an eight ohm load.)

So how efficient is that in conventional terms? Brace yourself: that is 0.5% efficient. In other words, if your loudspeakers are typical, 99.5% of the power you pump into them is converted to heat in the loudspeaker, with just a smidgeon left over to produce actual sound.

The logarithmic maths involved is far from linear. A typical sensitivity for speakers with a home theatre in a box system from a Japanese or Korean maker will be around 84dBSPL. That comes to an efficiency of just 0.16%.

A home theatre or hifi loudspeaker designed with an emphasis on efficiency can often be much higher. Typically they top out around 95dB, which is 2% efficient. Truly a terrible figure, but far less so than the normal one.

Now, back to cinemas. How do they get so loud? By employing highly efficient loudspeakers. Consider Krix’s top of the line four-way cinema speakers. Their rated sensitivity is 110dBSPL for the bass driver and 108.5dBSPL for the mid/HF/UHF drivers. Those numbers equate to 63% efficient for the bass driver, and 45% efficient for the rest.

Just think: if you have a powerful, high quality system and you play your music loud, you might hit 110dB peaks from time to time. With these speakers in your room, you’d manage that with just a watt and a bit of input.

For the record, a theoretical 100% efficient loudspeaker would have a sensitivity specification of 112dBSPL for 2.83 volts, measured at one metre.

Posted in Audio | 1 Comment

The Other Side of Hifi-Writer

Happy New Year all. For those interested, occasionally I do a little political/economic opinionating

buykamagrausa.com

, which I try to keep well away from this Blog. For those interested, I’ve got a piece up at ABC’s The Drum in which I criticise the ACCC.

Posted in Uncategorized | 1 Comment

569

That’s the number of spam comments for one post that Akismet has rejected from just one blog post

, I see. All were (attempted to be) posted in the last eight hours. Something about the title or content that’s attracting this kind of interest?

UPDATE: 11:27am

2pharmaceuticals.com

, 18 November 2013

Make that more than 6,000. There are over 5,500 new attempted spam comments that Akismet stopped. Weird.

Posted in Admin | Leave a comment