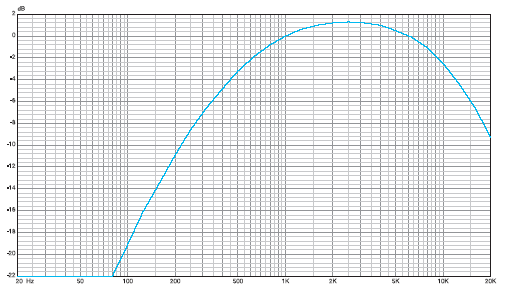
The aim of makers of high fidelity audio equipment is — or at any rate, ought to be — to produce equipment that does not modify the signal, other than convert it (from a digital to analogue representation, or from electrical to acoustical action) or amplify it. One component of this is having a totally flat frequency response. It may seem odd, then, that much of the technical measuring of audio equipment involves shaping the measured frequency response, using A-weighting.
 The purpose of this is to provide a signal to noise ratio figure that more closely represents the human experience than a straight unfiltered measurement. The human ear is very much less sensitive to, for example, bass frequencies, than it is to midrange frequencies. Our ears are at their most sensitive around 3,000 to 4,000 hertz. A nasty noise produced by an amplifier in this range of frequencies is very much more intrusive than a deep bass hum.
It is hard to find on the Web precisely what action an A-Weighted filter has. Happily, Greg Borrowman, the editor of Australian HI-FI (for which I write), is a true gentleman. Having researched the matter and generated the curves, he has given me permission to provide them to the world via this site.
So, for the A-weighting curve alone, download this 31kB PDF. If you want to explore further, you can download this 43kB PDF which has the A, B, C and D weighting curves. The last is a doozie. Greg says of it:
It was apparently used when measuring noise in avionics applications, because it penalised engines with lots of output (noise!) in the speech area.
I shall have to set up a download page for this kind of thing. Shall do so in the next few weeks to avoid people having to search the Blog archives.
UPDATE (Tuesday, 22 February 2005, 9:22 am): Greg also forwarded the underlying data for these curves in text files. The data is the decibel offsets from a flat response at one third octave intervals from 10 to 40,000 hertz. I’ve taken the liberty of stuffing them into an Excel spreadsheet and graphing them, in case someone may prefer to fiddle with the raw data. Right-click here to download the spreadsheet.
